In part 1 of this blog series we laid out why we created the ‘pmax script’, why we gave it for free to the community & how you can get your copy up & running.
Assuming you’ve done that, you’ll now have a Google Sheet that looks something like this:
So naturally the next question we’ve been asked is “how did you do this & what do I do with all this data?”
This blog post aims to answer that question.
How is the data calculated?
The data is pulled from Google’s API (essentially ‘behind the scenes’ of your ad account) and passed into the sheet – that’s what the script does.
It then digs into some details about the available data for all ad assets in all of your performance max (pmax) campaigns.
For instance we can see:
- the ‘type’ of an ad (eg Text, Image or Video)
- More detail about that asset, eg is the image a logo or a ‘marketing image’, is the text asset a headline or a description etc
- Was it provided by you, or ‘auto created’ by the AI
- The performance of each asset in each campaign
Next we determine the channel that asset would most likely be used on. The four options are:
Video, Shopping, Display & Search/Other.
For instance a video asset will be categorised as spending on the video channel. Mostly this will be Youtube, but it could be shown in a video ad on a Display Network placement or even in an app.
Products will mostly be shown in shopping ads on Google, but some impressions will be remarketing ads on GDN or even shopping ads seen on Youtube – those are all labelled as ‘shopping’ as Google doesn’t provide the granular data of exactly where the impression was shown.
The hardest channel to define is ‘display’. It’s an educated guess, but we’ve decided to categorise any ‘marketing images’ as display & ignore the other types of image, since ‘logos’ can be used in multiple types of ads.
The rest is put into a bucket labelled ‘search/other’. It’s just not possible to accurately know how much spend (or how many conversions) should be attributable to search as data is only provided at the individual asset level – ie for each headline, each description etc.
There’s no useful data to show exactly how many headlines were shown in a particular ad – so it’s not possible to sum the spend across all headlines to calc a total spend. So we sum the other 3 above & then deduct that from the total for the campaign, to get the total spent on search.
An example to help explain
In the image below taken from the ‘Campaigns’ tab of the pmax sheet:
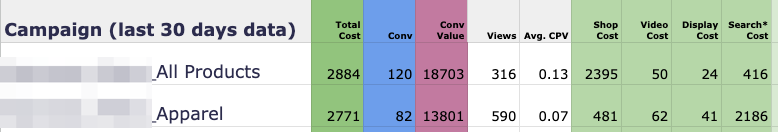
The top campaign (ending in ‘all products’) has spent a total of $2884 in the past 30 days.
Using the assumptions above, we can calculate the total spend on shopping ads to be $2395, video as $50, display as $24, leaving $416 for ‘search/other’. It’s not “accurate”, but it’s useful. And given the available data, that’s the best we can hope for! (yell at Google not us).
Go check your sheet – what spends are you seeing across the various channels? Is that what you were expecting?
On that same tab, you’ll also see totals for the number of conversions & the total ‘conversion value’ (ie revenue). As well as the percentage across the channels for each.
Keep an eye on the AI
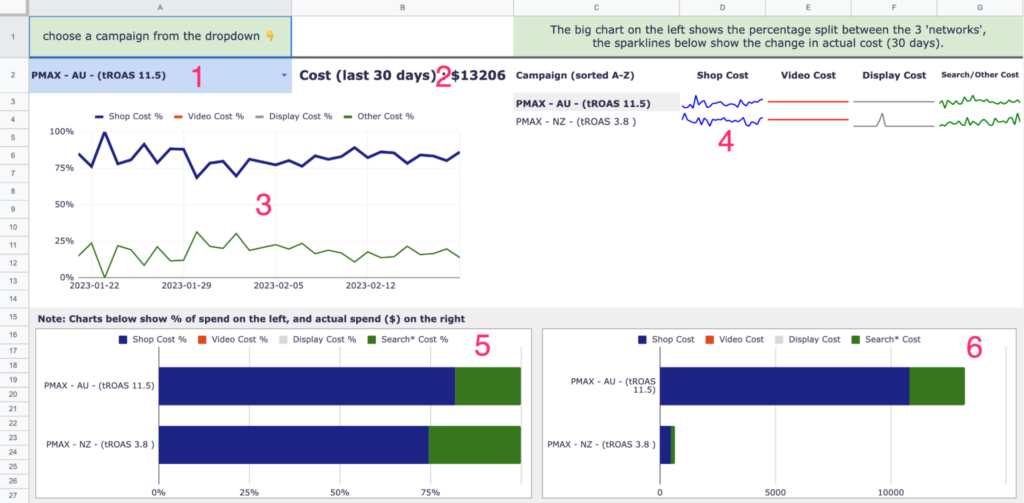
Knowing the totals is a great start… but visualising that over time is often even more useful. The main tab you’ll use for that is the ‘Charts’ tab.
Choose the campaign you want to examine from the dropdown
The chart below shows the percentage of spend over time for the 4 main ‘channels’ within Google Ads.
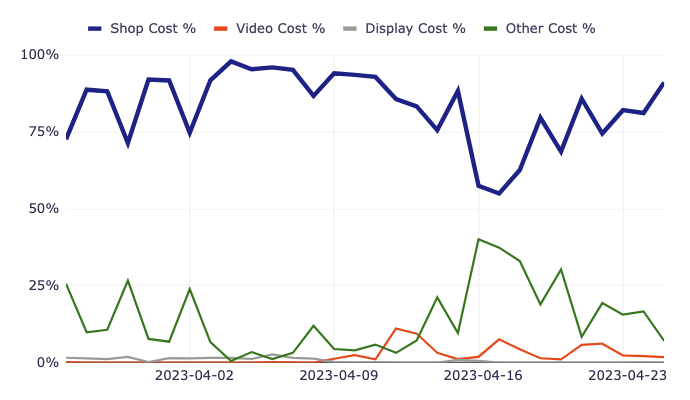
For example in the image above, you can see at a glance that ~80% of the spend is on shopping ads, but there was a bit of a blip in mid April when the machine started spending more on Search/Other.
Other Charts
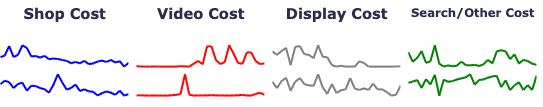
On the top right of the Charts tab, you’ll see some sparkline charts – these show the actual spend (not the percentage) on each channel over the past 30 days.
The chart bottom left shows the % of spend as a stacked bar chart for each campaign
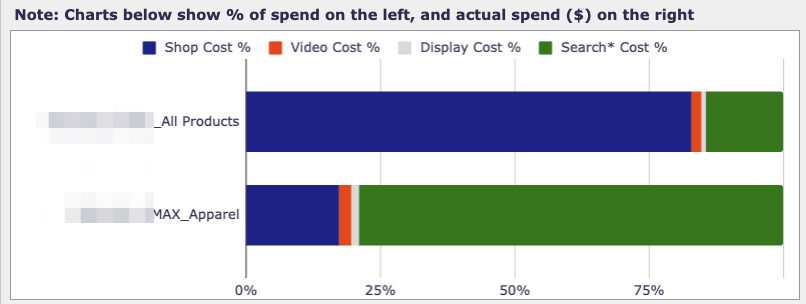
Here, for example, you can see that the ‘all products’ campaign is spending mostly on Shopping, whereas the bottom campaign is mostly Search.
Lastly the chart bottom right shows the actual spend on each channel (again, based on the assumptions above) so that you can see at a glance which campaigns are most important & deserving of your time.
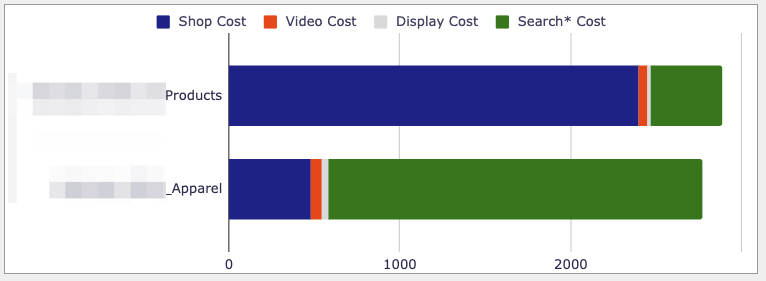
Sometimes you’ll find a campaign spending mostly on Search isn’t spending much & so the insight isn’t very helpful. However in this case you can see that although the channel mix is very different for these 2 campaigns, the total spend is similar for both – both spending just under $3k a month.
Knowing this, helps you determine where to spend your time optimising the account.
Other useful information
There are many other tabs – but a key one to highlight is the ‘Asset Groups’ tab.
This shows the asset groups running in each campaign as well as the performance of each.
Funnily enough this is a report that Google themselves have now said they will make available in the near future (until that rolls out, this script is the only way we know of to see this level of detail).
The big caveat with this data!
The only main criticism we’ve heard in relation to the sheet & script is
Yes, but what can I DO with this data?
Because if you can’t take action – then why have the data, right?
And given the restrictions with pmax campaigns, at first glance there’s not much that you can do!
But you can make a change & monitor the result. What can you change?
Change your campaign budget – what happens to the mix of channel spend?
Change your target ROAS – again what happens next?
Change the targeting of your asset groups – do they get more or less impressions (use the AG Impr tab), do those impressions lead to revenue (AG Value tab)
Change the products in the Asset Groups – again does this help or hurt you?
Split your asset groups into more (or less) groups – how does that affect impressions?
Delete the auto-created videos, or replace them with decent videos with a strong CTA – does that change the % of spend on Video? Does it improve the ROAS for video (see the Campaigns tab).
Why only 30 days? Can we get more?
Most people are delighted with this additional data & transparency… but one other issue that occasionally comes up is why only 30 days?
The reason is two-fold.
One Google Sheets has finite capacity & pulling data for longer periods would use a lot more space & slow the sheet down.
Scripts too have a time limit to run & the longer the time period, the more likely scripts are to timeout.
Also, how helpful is it really to know what happened in your account 70 days ago? How actionable is that data.
Running a very large account?
Lastly you may get an error about the Sheet running out of space. We’ve heard from dozens of advertisers that run hundreds of campaigns across millions of products. If that’s you, then this sheet probably isn’t going to cut it. You’ll want to use Big Query for that level of data.
We can help with that & set all this up for you in a way that can pull huge amounts of data & enable you to visualise them in Sheets or Looker Studio. Fees start at $10k for that, get in touch if you’re interested.
Now over to you
Now it’s your turn.
If you haven’t yet, go install the script from https://github.com/agencysavvy/pmax
Create your own version of the Sheet (we can’t see your data)
& start analyzing your account today.
Let us know what you find!