The archery board is a visual metaphor Mike has used for well over a decade to explain to business owners the relationship between spend, revenue, ROAS (return on ad spend) and profit. This post will explain not every dollar of investment into digital ads is equal.
1. Archery board metaphor
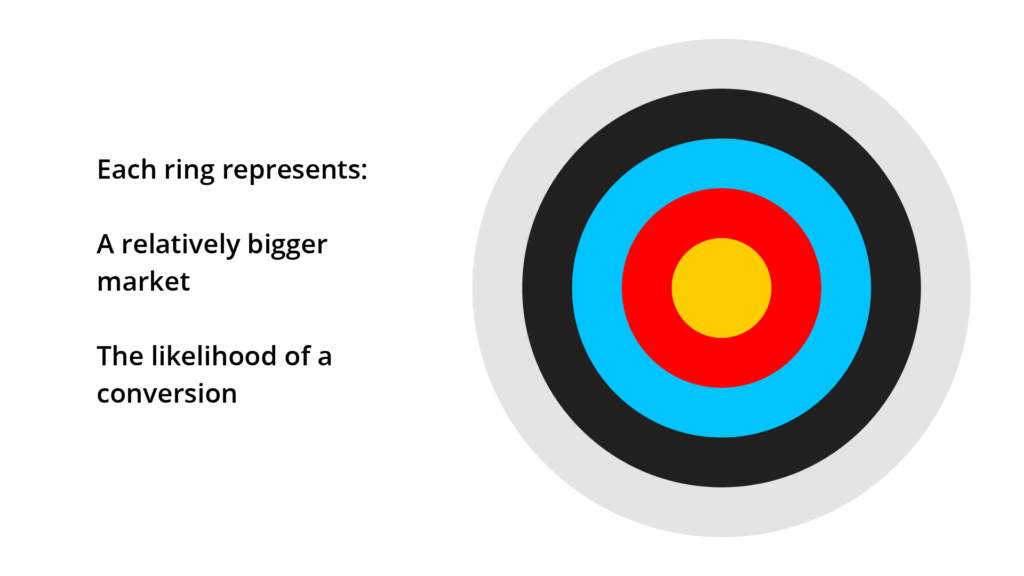
To help explain this relationship, think of an archery target – something that we’re all familiar with and understand. The bulls-eye on the archery target is undoubtedly harder to hit and therefore is worth more points The white band around the outside is much bigger and therefore easier to hit, but it’s worth a lot less.
We can apply a similar premise to Pay Per Click advertising such as Google Ads. The bulls-eye in the middle represents the group of people that are searching for your business by name (potentially a fairly small group). They know exactly the product or service that they want to buy and they’ve got their credit card ready. And so the conversion rate for this group of people is much higher and therefore “worth more points” to the business.
This group yields more revenue to the business, but we can’t spend the entire budget on that little group of people because there just aren’t that many of them. So we spend as much as we can here and are then forced to spend money on the next group of people, the next ring on the archery target.
But this group is less likely to convert. It’s likely to still be profitable to show ads to this group, but the profit from that incremental investment isn’t as high compared to the previous group, the bulls-eye. And so revealed; the whole game that we’re playing as Digital Marketers, month on month, week on week, with your hard-won marketing dollars is figuring out the optimal amount to spend and where to spend it for the maximum gain to your business.
2. X and Y axis relationship of ROAS
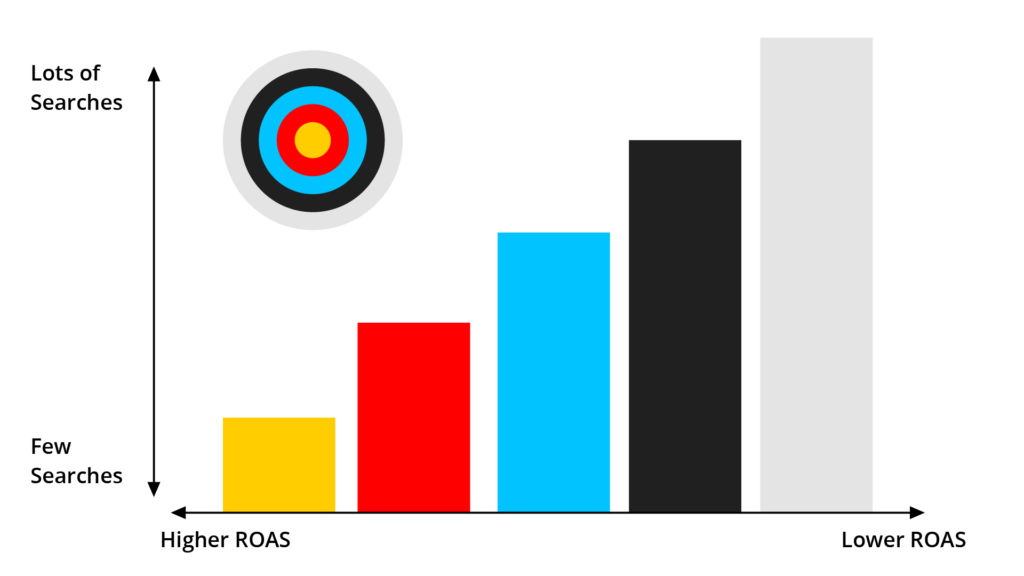
Now, if we think about this slightly differently, we can use a graph. The Y-axis being the size of the addressable market, with an increasing volume of people as you move upwards and the X-axis being the likelihood of purchase or conversion rate, becoming less likely as we move across.
This is directly comparable to the bulls-eye metaphor. The Y-axis may represent a particular collection of keywords, a particular audience or maybe even a location. For example, the Y-axis is the number of people searching for certain keywords in a specific location. People searching for the keywords in Melbourne may have less volume but are more likely to convert (bulls-eye) opposed to the same keywords in New Zealand (outer ring of the bullseye).
New Zealand remains in your addressable market, people will still buy, but at a lot lower rate compared to Melbourne; your core group of bulls-eye people.
In terms of Google ads, the number of searches per month or per day shown to a group of people we know will convert (your bulls-eye) is finite, but highly profitable to show an ad to.
But we’re constrained. There is a natural limit each day or each month of how many people are actually going to search for this particular group of keywords with a high intent to purchase. We’re always going to start here as it’s the most profitable, but we can’t spend the entire budget here.
So where to from here?
3. Incremental increase in spend vs Incremental revenue return
It’s at this point we find for our clients another group of people that we expect to still be profitable. Let’s experiment with showing ads to that group by increasing the budget and testing this next “universe” of keywords, a new location, or a new type of campaign. Then we optimise that new traffic to get that to be profitable too. If we can fantastic, then we continue to test the next group. This is how we expand a Google ads account profitably.
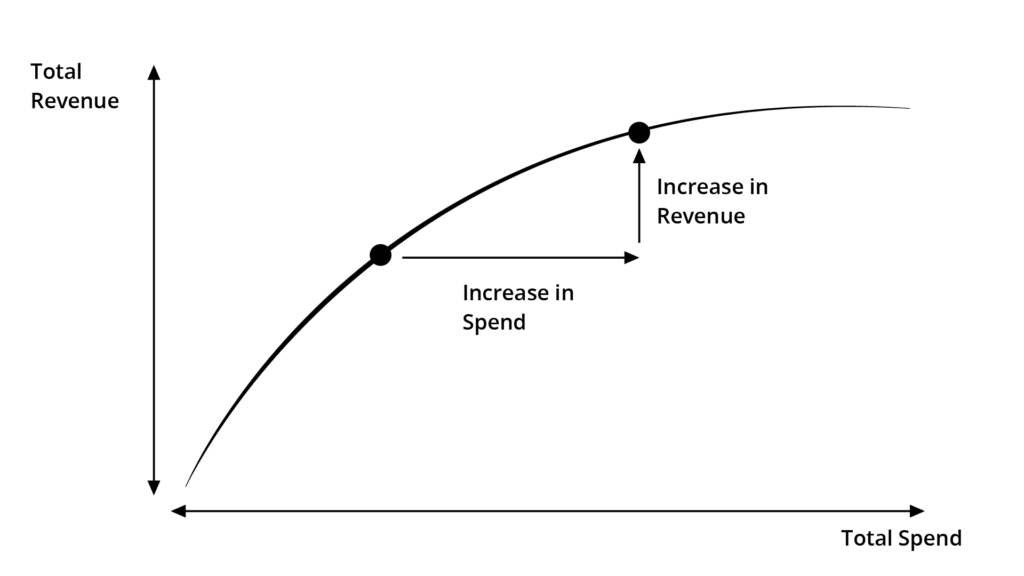
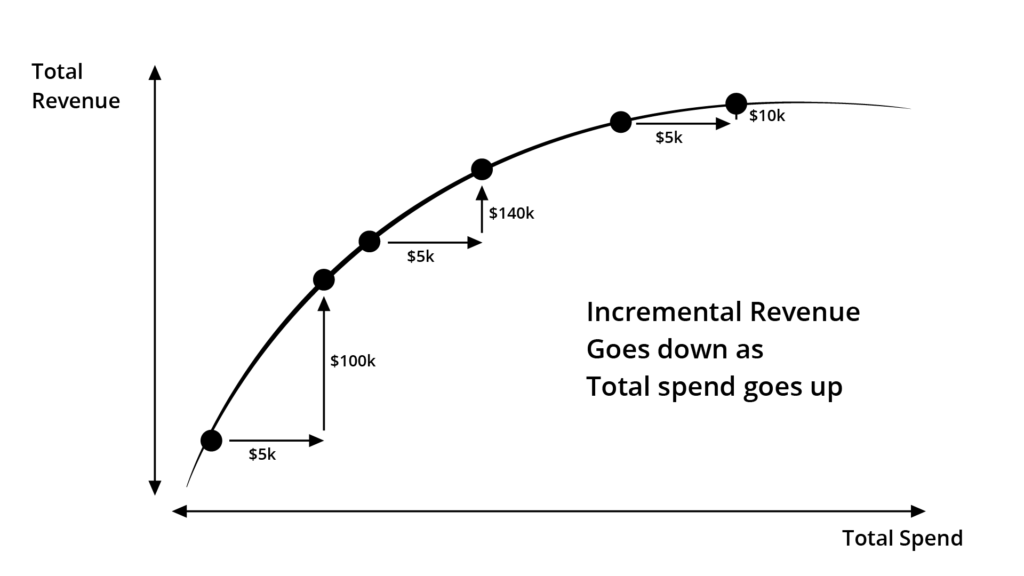
Here’s another way to think about this… as spending increases and as we work through these different markets, these different groups of people, total revenue is going to accumulate.
Any cumulative chart is always headed up into the right corner of a graph. The platforms want you to focus on this “ever increasing” number however, we want you to go a level deeper and focus on the incremental changes.
As you increase spend the total revenue is always going up, but it isn’t nearly as profitable as we invest to get closer towards the right-hand corner of the graph. The average ROAS at this point is starting to decline.
The best way to think about this is to break it down into chunks. For each incremental increase in spend, what’s the corresponding increase in revenue for that particular chunk?
In the beginning, when you’re not spending much on Google Ads and you increase your spend, it’s going to result in a much larger jump in revenue. Compared to when the account is very mature and you’re spending as much as you possibly can and you want to increase things a little more. Adding an extra $5k, when we’re already spending $20k is probably going to improve things, but not nearly by as much as that first $5k of investment (each month).
Let’s put some numbers to this
For this first “chunk” you are spending $5,000 with a $100,000 revenue giving an incremental ROAS for the section a 20x. That is you’re getting $20 out in revenue for every dollar that you tip-in.
If we were to continue to grow the account another five grand, we might find that the incremental revenue is around about $40,000 or an 8x ROAS. This is still going to be profitable, but this incremental ROAS is obviously smaller than for the first $5,000 investment.
We keep on growing, keep on increasing spend in the account.
And as we get to the pointy end, the account is now spending $100,000 a month and this next $5,000 increase in spend might only get a $10,000 increase in revenue.
Total revenue has still gone up. And your average ROAS for the whole account didn’t go down by much so it appears profitable. But if we dig into the incremental change, that last $5,000 increase only gained another $10,000 in revenue, the incremental return on ad spend at this point is only 2x.
For most e-commerce businesses, this isn’t going to be a profitable increase in spend. If your business objective is; market share, share of voice or if you’re simply after eyeballs on your ads, then this may not be a problem. But if your KPI, your metric of success, is a ROAS of at least 5x in order to be profitable, then this incremental increase isn’t a good use of marketing funds.
Our goal is to increase the overall spend to the point where we maximise profit for the business, which requires thinking about incremental spend & revenue, not just looking at averages.
WebSavvy has been doing this for well over a decade and a half and it’s our job to maximize total profit for your business and go beyond just getting as much profit as we can for a fixed amount of budget.
This kind of growth requires a lot of experimenting, a lot of testing and new ideas. Of course, the game is always changing, it would be lovely if everything in the world of digital marketing stayed fixed. But your competitors are changing their strategies, your budgets are changing, your product lines are changing, you’ve got stock going in and out, maybe you’ve got supply chain issues. In a global pandemic there are many, many factors affecting results.
But that’s our job; to maximize the amount of profit for an amount of spend, to help set those budgets and to help you understand where to spend more and which tests to run next.
This post has been put together from a video explaining these different ways to think about ROAS. If you would like a copy of this video or if you’d like us to help you maximise your profit, please reach out via live chat or get in touch, and we’ll send you a copy!